Friday, June 22, 2018

10 mistakes to avoid while Hunting for multibaggers

The return-hungry investors who are always looking for stocks which could give multibagger returns normally end up picking up stocks which either don’t perform or even if they perform they would give returns less or equal to benchmark returns.

Being able to spot a potential multi-bagger stock early definitely requires some research, along with that, patience plays a key role. Such stocks do exist, and if you have already done your research then the ideal time to pick them is on every decline.

Here are a few parameters that can help you spot a potential multibagger stock early – focus on the growth rate of the industry including future growth potential, which would benefit the stock under consideration.

Apart from that if there are entry barrier that would prevent competition. High-quality management is an added advantage and is like a precondition for the creation of long-term wealth for investors, suggest experts.

The other measure to look at is financial ratios. “Although not strictly defined, but a consistent low debt-to-equity ratio, high returns ratio, and free cash flows are some of the key indicators we have seen in the multibaggers in the last decade,” said, Nidhi Agrawal, an analyst at Angel Broking

Here are 10 mistakes as highlighted by different experts which one should avoid making when hunting for stocks which could potentially give multibagger returns: 

1.Herd mentality: 

Many investors fall victim to following stock tips by friends, neighbours and so-called experts. These picks rarely work out. In order to make money in equities, the conviction is necessary in an investment, which leads to the ability to hold on to a stock holding through volatile times and sell-offs.
If an investor does not understand a business, he should not invest in the company.  If an investor is unwilling to put in the time to research equities, then they are better off letting professionals manage their portfolios.

2.Investing in stocks based on low price: 
Just because a stock price is low does not mean that the stock is an attractive investment. I have surprisingly met clients that make the mistake of equating low price to cheap.
I once met a client that would only purchase stocks selling less than a certain price. However, even a stock selling at Rs 15 can be incredibly expensive while a stock selling at Rs 1,500 can often be cheap. Low price does not mean an attractive investment.

3.Holding on to losers: 
If a stock is down, there is a reason it is trading lower. It is best to regain losses by moving the money to an attractive investment.
Investors often make the mistake of being unwilling to take a loss on a position. However, if you think about investing logically, it is clear that if a stock has sold off, there is a reason it has done so, and it may never reach back the same levels or may take a long time to do so.
In many scenarios, the investor would be much better off putting money in an attractive alternative investment that would give them a better chance of recouping the loss.
Most importantly, avoiding and minimizing crippling losses is a discipline many investors don’t follow.

4.Investing at high P/E multiples:
An investment return is often determined by the price paid. At 100 times P/E, for instance, an investor is paying 100 times the trailing earnings over the past 12 months of the company. That is an awfully expensive price.
It means it will take the investor 100 years to make back his investment.  Very few stocks are able to deliver the growth that justifies this sort of a premium. Therefore, the valuation paid is crucial in determining future returns.

5.Investing in risky bets: 
Investors want to make money quickly and take larger speculative bets.  These bets often lead to large losses. I have come across many investors that have bet on so-called sure shots, home runs, multibaggers.
In my experience, the vast majority of these investors end up taking losses.  These companies often have been hyped up by people on the street that are looking for suckers to pile in.
There are many ways that investors are taken advantage of, and it is up to the investor to recognize the dangers and work with an experienced advisor.

6.Focusing more on macro data than on stock fundamentals: 
Blind investment in equity without looking much into the stock specific fundamentals should be avoided.

7. Just going with the hot picks or flavor of the season: 
They both need to be analyzed before investing for the earning potential of the company/industry dynamics.

8.Overlooking corporate governance issues: 
With the number of scams and frauds coming up, one needs to do best possible due diligence for the corporate governance of the company.

9.Over-allocation/under allocation to particular stock: 
While asset allocation is highly subjective and varies from person to person, a prudent investment strategy says that the allocation should be in line with the conviction and risk appetite of the investor.

10.Discontinuing monitoring of stock/key variables: 
Once an investor has taken a position in the stock, he/ she needs to regularly monitor the investment thesis, changing variables etc. to understand whether it is on the right track.

Next Read :Fine Organic Industries IPO Review

Saturday, June 16, 2018

Fine Organic Industries IPO Review

Fine Organics is coming up with an IPO. The company is based in Mumbai and incorporated in 2002. Fine Organics is a manufacturer of oleochemical-based additives. They are leading producers of specialty additives for foods, plastics, rubbers, paints, inks, cosmetics, coatings, textile auxiliaries, lubes and several other specialty applications. They have products facilities at Ambernath, Badlapur and Dombivli in Maharashtra. They are 64300 tonnes production capacity as per 2017 reports. They have over 500 full time employees on payroll. They have strong R&D capability and developed over 46 new products since 2014.
Fine Organic Industries, a chemicals firm has fixed a price band of Rs 780 to Rs 783 per equity share to raise around Rs 600 crore through an initial public offering (IPO). The offer for sale will see divestment of 25 per cent of stake of 76,64,994 equity shares by the existing shareholders. The issue will open on June 20 and closes on June 22. The 48-year old company held entirely by the promoters family had filed draft papers with markets regulator Sebi to float the IPO in February. 
It has three manufacturing facilities in the suburbs of the megapolis, including Ambernath, Dombivli and Badlapur, with a total installed capacity of about 64,300 tonnes per annum (tpa). "The company has drawn up capital expenditure of Rs 270 crore to expand capacities over the next 2 years and has already invested Rs 70 crore towards equity portion," Fine Organics CFO and director Tushar Shah told reporters at the IPO roadshow here. 
The company is expanding its Ambernath facility by adding a capacity of 32,000 tpa at a cost of Rs 130 crore, and it plans to fund 30 per cent from equity and 70 per cent from debt, he said. It is also looking at investing Rs 55 crore in setting up Fine Zeelandia facility in Mumbai in association with Dutch family-owned Zeelandia International, a part of the Royal Zeelandia group, he said.
The company clocked net revenue of Rs 581 crore for the nine-months period ended December 2018. It has launched 387 products and exports accounts for 65 per cent of the total revenue, Shah added. Meanwhile, as part of the global expansion plans, it is also setting up a joint venture firm named FineAdd with the German partner Adcotec, to own and operate a 10,000 tpa facility in in Leipzig, Germany, which will be operational by Q3 FY20, according to the offer document. Fine Organic will own 50 per cent and Adcotec will own the other 50 per cent, it added. 
Highlights of the Company:
a. Consistent market leadership position in the Indian mutual fund industry;
b. Trusted brand and strong parentage;
c. Strong investment performance supported by comprehensive investment philosophy and risk management;
d. Superior and diversified product mix distributed through a multi-channel distribution network;
e. Focus on individual customers and customer centric approach;
f. Consistent profitable growth; and
g. Experienced and stable management and investment teams.
Main object of the issue is:
The objects of the Offer for the Company are to achieve the benefit of listing the Equity Shares on the Stock Exchanges and for the sale of Equity Shares by the Promoter Selling Shareholder. Further, the Company expects that the listing of Equity Shares will enhance its visibility and brand image and provide liquidity to its existing shareholders.
Positives For the Company:
Largest Producer of Oleochemical-based Additives in India.
Company is the largest manufacturer of oleochemical-based additives in India and one of the few large players in global oleochemical-based additives industry.They are one of six global players in the food additives industry and one of five global players in the plastic additives industry.Company has a huge first-mover advantage in India, alongside various other competitive advantages over other global players. This gives Company an advantage in pricing products competitively and allows them to provide stiff competition to new players. Hence, no major domestic or global player has set up a manufacturing facility in India.
Specialised Business Model with High Entry Barriers.
There are multiple entry barriers for a new entrant in the global oleochemical-based additives industry, such as product formulations, process technology and customer stickiness to established players. As a result, they are one of the few large global players in this industry.Because of high Entry barriers, Company is able to obtain higher EBITDA and profit margins for their products compared to other manufacturing industries where barriers to entry are lower.Company’s EBITDA margins were 18.54%, 22.11%, 18.43% and 17.78% for Fiscals 2015, 2016, 2017 and the nine months ended December 31, 2017, respectively.
Diversified Customer Base with Long Term Relationships with Marquee Customers.
Company has 603 direct customers and 127 distributors (who sold than more than 5,000 customers). Company’s direct customers are multinational, regional and local players manufacturing consumer products, such as Hindustan Unilever and Parle Products, and petrochemical companies and polymer producers globally.Company has an extensive distribution network in India and worldwide, enabling their products to be sold in 67 countries.
Diversified Product Portfolio Catering to a Variety of High Growth Industries.
As at December 31, 2017, they had a range of 387 products sold under the ‘Fine Organics’ brand, used in the (a) plastic industry and (b) food industry and others (cosmetics, printing inks, coated papers, lube additives, wires and cables, coatings and other specialty applications) industries.
IPO Particulars:
IPO Opens on : 20 June 2018
IPO Closes on : 22 June 2018
Issue Type: Book Built Issue IPO
Issue Size: 7,664,994 Equity Shares of Rs 5 aggregating up to Rs [.] Cr
Face Value: INR 5 per share
Price Band: INR 780-783 Per Equity Share
Minimum Order Quantity: 19 shares
Listing will at: BSE,NSE
Shares offered to
Anchor – 22,99,497 Shares = 180.05Crore
QIB – 15,32,999 Shares = 120.03Crore
NII – 11,49,750 Shares = 90.03 Crore
RII – 26,82,748 Shares = 210.06Crore (Lot size: 19 = 1,41,197 Forms)
Total Issue – 76,64,994 Equity Shares = 600.17 Crore
Financials: Consolidated Figures
EPS for 2016-17 : INR25.56
EPS for 9M of 2017-18 INR 26.38
PE Ratio on EPS of 2016-17 : 30.63
RONW for 2016-17 : 24.65%
RONW for 2017-18 9M  : 17.34 %
NAV as on 31.12.2017 :INR 114.65
Upper PBV : 6.83
Fine Organics Financial:
  Rs. in Crore
RevenueExpensePAT
2013497.5466.620.9
2014574.2479.661.7
2015616.5530.957.1
2016667.7550.876.2
2017792.7671.877.7
2018 (9M)594.7500.258.5
Company Promoters:
  • Prakash Damodar Kamat
  • Mukesh Maganlal Shah
  • Jyotsna Ramesh Shah
  • Jayen Ramesh Shah
  • Tushar Ramesh Shah
  • Bimal Mukesh Shah
Peer Company Comparison :Galaxy Surfactants :
Face Value : INR 10
Price : Rs. 1299 on 13 June 18
Total Income :  INR 2171.70 Crore
PE  : 34.7x
NAV  :INR 161.51
P/NAV:  8.05
Main Global Competitors for the Company: 

Quick Links:DRHP Draft Prospectus
Fine Organics IPO Market Lot:
  • Shares: Apply for 19 Shares (Minimum Lot Size)
  • Amount: Rs.14,877
Fine Organics IPO Allotment & Listing:
  • Basis of Allotment: 28-June-2018
  • Refunds: 29-June-2018
  • Credit to demat accounts: 02-July-2018
  • Listing: 03-July-2018
Tentative timeTable:
13 June 18– Price Band announced
19 June 18 – Anchor List
27 June 18– Finalisation of Basis of Allotment
28 June 18– Unblocking of ASBA
29 June 18– Credit to Demat Accounts
2 July 18– Listing on NSE & BSE
Fine Organics IPO Lead Managers:
  • Edelweiss Capital Limited
  • JM Financial Consultants Private Limited
Company Address:Fine Organic Industries Limited
Fine House,
Anandji Lane
Ghatkopar (East), Mumbai 400 077
Phone: (91 22) 2102 5000
Fax: (91 22) 2102 8899
Email: investors@fineorganics.com

Website: http://www.fineorganics.com
Fine Organics IPO Review:
  • Apply for Short Term and Long Term.

RITES IPO Review

In the first divestment of the current fiscal, the government is selling 12% stake in railway consultancy firm RITES to mobilise about Rs 460 crore, with the price band fixed at Rs 180-185 per share. All retail investors and employees of the company will get a Rs 6-per-share discount on the final IPO price. The IPO will open on June 20 and close on June 22, the company said on Tuesday. 

In February last year, finance minister Arun Jaitley had announced in the Budget that the government would divest stakes in at least three railway assets which included IRCTC, IRFC, IRCON. RITES was added to the list of divestment target later on. Even Rail Vikas Nigam, another PSU under the railways may soon launch its IPO, having obtained the regulatory nod last month, merchant bankers said.

Through the RITES IPO, the government is selling 2.52 crore equity shares, including 12 lakh shares reversed for its employees.
For fiscal 2019, the government has set a divestment target of Rs 80,000 crore. In fiscal 2018, the government had mobilised a little over Rs 1 lakh crore through PSU sell-offs.


RITES Limited is promoted by President of India. The company is a Gov. of India Enterprise. 
They work under Indian Railways. RITES Ltd is a 9001:2008 company and work a multi-disciplinary consultancy organization in transport, infra and related technologies field. 

They work a links with local consultants for overseas projects. They are expertise in quality assurance and transport infrastructure consultancy provider. 


They have clients which includes Indian Railways, NTPC, SAIL, Rashtriya Ispat Nitam Limited, HPCL, Bharat Coking Coal Limited, Metro Link Express for Gandhinagar and Ahmedabad Company Limited (MEGA), Airports Authority of India, Titagrah Wagons, Cimco Ltd, Rajdeep Buildcon Pvt Ltd, Geokno India Pvt Ltd, ARK Services and more. 

The company looks good and it will be good to see how it will perform as other government companies not able to perform well except Midhani Ltd.

RITES Ltd IPO Review:
  • Apply with Short Term & Long Term Gain
RITES Ltd IPO Dates & Price Band: (Approx)
  • IPO Open: 20-June-2018
  • IPO Close: 22-June-2018
  • IPO Size: Approx Rs.466 Crore (Approx)
  • Face Value: Rs.10 Per Equity Share
  • Price Band: Rs.180 to 185 Per Share
  • Listing on: BSE & NSE
  • Retail Portion: 35%
  • Equity: 2,52,00,000 Shares
  • Discount: Rs.6 (Retail & Employees)
RITES Ltd IPO Market Lot:
  • Shares: Apply for 80 Shares (Minimum Lot Size)
  • Amount: Rs.14,800 (For HNI & QIB)
  • Amount: Rs.14,320 (For RII & EMP)
RITES Ltd IPO Allotment & Listing:
  • Basis of Allotment: 28-June-2018
  • Refunds: 29-June-2018
  • Credit to demat accounts: 02-July-2018
  • Listing: 03-July-2018

Saturday, June 9, 2018

10 Traits to look for in multibaggers

Most of us are aware of the conventional stock picking metrics; visionary promoters, good management, scalable business and rich ratios.

Stock investor Soumya Malani suggests that investors get more specific in their hunt for alpha. The CEO of ShareBazaar App, he tweets at @insharebazaar.

Here, We narrow down on some patterns that investors could keep an eye on.

    Look at the negative working capital pattern.

At first blush that sounds a bit off since negative working capital would signify a company’s liabilities outweighing its assets. This puts the company in a feeble light. But that’s not what I am focusing on. Negative working capital also means the business which operates on Other People's Money, or OPM, or the suppliers money. Advances from customers is a good hint to go by.

    Companies which are leaders in a niche area and have a tiny market cap.

If you have the patience to wait for the business to grow and the market to subsequently realise its potential, you are sitting on a huge multi-bagger. This reminds me of the domestic consumption story. If one looks back at the market-cap of Cera Sanitaryware, Symphony or La Opala, it’s clear they were just too miniscule when compared to the scale they catered to, with an efficient supply chain and distribution network in place. Eventually, tailwinds prevailed, and the market catapulted them into a different orbit.

    Keep an eye on acquisitions and takeovers.

Uniply and Kingfa are cases in point, each over-30 baggers in the last 3-4 years.

In retrospect, Kingfa was a common-sense choice. This Chinese giant grew from nothing to be Asia’s largest compounder and boasted a track record of 65% CAGR for 22 long years in China. When it saw its market getting saturated in China, it acquired an Indian company (then known as Hydro S&S) by paying 3x premium to its prevailing market price. This increased the efficiency and the stock became a huge multibagger.

    Eradication of non-core diworsification.

A company could sport a sturdy and profitable core business, but owing to loss making non-core units, the overall Balance Sheet and Profit and Loss statement would be a farrago of misrepresentation. A shrewd move would be to sell those units and plough back the funds into its core business which would further accelerate growth. The market loves such stories.

    Companies that outperform during huge headwinds.

TV Today is a classic example. Barring the Aaj Tak parent, every single company in the media sector was bleeding profusely. Digitisation was a game changer with the stock becoming a 12 bagger in last 4-5 years. Find companies which are making money when others from the same sector are unable to find their feet.

    Demerger in a sizeable company.

A billion-dollar market-cap company can demerge a unit with a ratio of 20:1 share. The demerged entity, as per the ratio would quote at say $100 million which would make no sense for foreign investors. Foreign institutional investors, or FIIs, have got a market-cap stipulation and hence they tend to sell out in haste without even caring about the intrinsic value. Arvind Infra and Marico Kaya are examples of huge value creation.

    Companies eating market share of market leaders.

Amara Raja and Havells ruthlessly cannibalized on the market share of leaders such as Exide and Crompton Greaves, respectively. Fifteen years ago, they were known to none with very thinly traded volumes. The upstarts are now the numero uno players in their own space.

    Second-run companies in sectors where the leader has been a multibagger.

This is a very interesting pattern which often gets played out in different sectors. At some time, the valuation of the significant player gets so stretched that investors start to look for the trivial peer where the valuation gap is much narrower. Think Avanti-Waterbase, Relaxo-Mirza and KRBL-Chaman Lal.

    Strong leverage but very efficient in working capital management.

Often, quality niche players backed by visionary pedigrees, to conquer more ground and stay undisputed would resort to capital expenditure through long-term debt. At some time, the capex would be covered for the next 3-4 years and just the maintenance capex remains. So, all operating cash flow goes in debt repayment and net profit vaults.

    Legacy companies witnessing the induction of a new generation.

The predecessors were habituated in siphoning off aka black money but the new players at the helm, who in all probability would be freshly groomed from renowned business schools, would be inclined to look at the market cap which is pure white stuff.

It's simple math. A small-cap promoter may siphon off Rs 5 crores via unscrupulous means. On the flip side, the next generation would consider showing the same through books of accounts. That same amount would mean an extra Rs 100 crores in market cap considering a PE of 20. On even a 50% ownership they get richer by Rs 50 crores. No prizes for guessing which is a better route. Presently, I believe that this area offers serious money-making opportunities and moves likes demonetization further reinforces my stand.
Next Read : The Capital Asset Pricing Model: an Overview

The Capital Asset Pricing Model: an Overview


No matter how much we diversify our investments, it's impossible to get rid of all the risk. As investors, we deserve a rate of return that compensates us for taking on risk. The capital asset pricing model (CAPM) helps us to calculate investment risk and what return on investment we should expect. Here we take a closer look at how it works.

Birth of a Model

The capital asset pricing model was the work of financial economist (and later, Nobel laureate in economics) William Sharpe, set out in his 1970 book "Portfolio Theory and Capital Markets." His model starts with the idea that individual investment contains two types of risk:
  1. Systematic Risk – These are market risks that cannot be diversified away. Interest rates, recessions and wars are examples of systematic risks.
  2. Unsystematic Risk – Also known as "specific risk," this risk is specific to individual stocks and can be diversified away as the investor increases the number of stocks in his or her portfolio. In more technical terms, it represents the component of a stock's return that is not correlated with general market moves.
Modern portfolio theory shows that specific risk can be removed through diversification. The trouble is that diversification still doesn't solve the problem of systematic risk; even a portfolio of all the shares in the stock market can't eliminate that risk. Therefore, when calculating a deserved return, systematic risk is what plagues investors most. CAPM, therefore, evolved as a way to measure this systematic risk.

The Formula

Sharpe found that the return on an individual stock, or a portfolio of stocks, should equal its cost of capital. The standard formula remains the CAPM, which describes the relationship between risk and expected return.
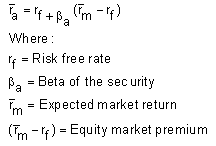
Here is the formula:
CT_CAPM_formula_r.gif
CAPM's starting point is the risk-free rate – typically a 10-year government bond yield. To this is added a premium that equity investors demand to compensate them for the extra risk they accept. This equity market premium consists of the expected return from the market as a whole less the risk-free rate of return. The equity risk premium is multiplied by a coefficient that Sharpe called "beta."

Beta

According to CAPM, beta is the only relevant measure of a stock's risk. It measures a stock's relative volatility – that is, it shows how much the price of a particular stock jumps up and down compared with how much the stock market as whole jumps up and down. If a share price moves exactly in line with the market, then the stock's beta is 1. A stock with a beta of 1.5 would rise by 15% if the market rose by 10% and fall by 15% if the market fell by 10%.
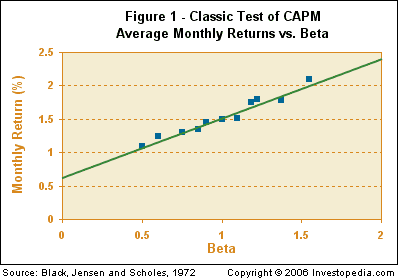
Beta is found by statistical analysis of individual, daily share price returns, in comparison with the market's daily returns over precisely the same period. In their classic 1972 study "The Capital Asset Pricing Model: Some Empirical Tests," financial economists Fischer Black, Michael C. Jensen and Myron Scholes confirmed a linear relationship between the financial returns of stock portfolios and their betas. They studied the price movements of the stocks on the New York Stock Exchange between 1931 and 1965.
CT_CAPM_1r.gif
Beta, compared with the equity risk premium, shows the amount of compensation equity investors need for taking on additional risk. If the stock's beta is 2.0, the risk-free rate is 3%, and the market rate of return is 7%, the market's excess return is 4% (7% - 3%). Accordingly, the stock's excess return is 8% (2 X 4%, multiplying market return by the beta), and the stock's total required return is 11% (8% + 3%, the stock's excess return plus the risk-free rate).
What this shows is that a riskier investment should earn a premium over the risk-free rate – the amount over the risk-free rate is calculated by the equity market premium multiplied by its beta. In other words, it's possible, by knowing the individual parts of the CAPM, to gauge whether or not the current price of a stock is consistent with its likely return – that is, whether or not the investment is a bargain or too expensive.

What CAPM Means for You

This model presents a very simple theory that delivers a simple result. The theory says that the only reason an investor should earn more, on average, by investing in one stock rather than another is that one stock is riskier. Not surprisingly, the model has come to dominate modern financial theory. But does it really work?
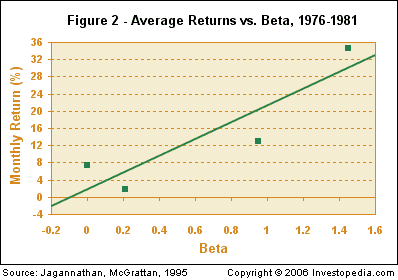
It's not entirely clear. The big sticking point is beta. When professors Eugene Fama and Kenneth French looked at share returns on the New York Stock Exchange, the American Stock Exchange and Nasdaq between 1963 and 1990, they found that differences in betas over that lengthy period did not explain the performance of different stocks. The linear relationship between beta and individual stock returns also breaks down over shorter periods of time. These findings seem to suggest that CAPM may be wrong.
CT_CAPM_2r.gif
While some studies raise doubts about CAPM's validity, the model is still widely used in the investment community. Although it is difficult to predict from beta how individual stocks might react to particular movements, investors can probably safely deduce that a portfolio of high-beta stocks will move more than the market in either direction, and a portfolio of low-beta stocks will move less than the market.
This is important for investors – especially fund managers – because they may be unwilling to or prevented from holding cash if they feel that the market is likely to fall. If so, they can hold low-beta stocks instead. Investors can tailor a portfolio to their specific risk-return requirements, aiming to hold securities with betas in excess of 1 while the market is rising, and securities with betas of less than 1 when the market is falling.
Not surprisingly, CAPM contributed to the rise in use of indexing – assembling a portfolio of shares to mimic a particular market – by risk-averse investors. This is largely due to CAPM's message that it is only possible to earn higher returns than those of the market as a whole by taking on higher risk (beta).

The Bottom Line

The capital asset pricing model is by no means a perfect theory. But the spirit of CAPM is correct. It provides a usable measure of risk that helps investors determine what return they deserve for putting their money at risk.