Wednesday, February 28, 2018

KEC International - 3QFY18 Result Update - Improved Project Execution Lifts Earnings


KEC International (KEC) has delivered a healthy performance in 3QFY18 with its revenue rising by 22.5% YoY to Rs24.0bn led by diminishing impact of GST. Consolidated net profit surged by 78.5% YoY to Rs1.1bn in 3QFY18 on the back of improved execution of T&D projects and higher operating margins. Looking ahead, we expect KEC’s earnings to clock 26.9% CAGR over FY17-20E on the back of strong order book, improving margin profile and healthy outlook in T&D and other emerging segments. Thus, maintaining our positive stance on KEC and rolling over our estimates to FY20E, we maintain our BUY recommendation on the stock with a revised Target Price of Rs445 (from Rs372 earlier).


Higher Revenue on Improved Execution
KEC’s revenue grew by 22.5% YoY to Rs24.0bn. SAE Towers’ sales grew by 40.8% YoY to Rs3.2bn owing to higher supply of towers in Brazil. Revenue from Power T&D business surged by 23.4% YoY to Rs18.5bn on improved execution. While revenue from Railways business grew by 98.5% YoY to Rs2.0bn, Civil (including Water business) recorded 321% YoY growth in sales to Rs0.8bn. However, revenues from Cables and Solar segment decreased by 2.0% YoY and 41.8% YoY to Rs2.7bn and Rs0.34bn, respectively. 

Operating Margin at Record Level; PAT Zooms
Despite higher commodity prices, KEC’s overall EBITDA margin expanded by 90bps YoY to 10.1% owing to better execution, absence of low-margin legacy orders in Water, Railways and Power Systems segments and execution of recently-bagged better-margin orders by SAE Towers. Its reported PAT zoomed by 78.5% YoY to Rs1.11bn.

YTD Order Backlog up 35% YoY; Order Intake Traction to Remain Strong
Post YTD order inflows of Rs113bn (+31%), KEC’s current unexecuted order book stands at Rs171.5bn. Notably, order inflows doubled on YoY basis in 3QFY18, while YTD order backlog grew by 35% YoY. Reiterating its FY18 guidance, KEC expects its order book to grow by double-digit in FY19. KEC expects interest cost to reduce and margin to improve further. It expects Cables business to get benefitted on the back of shifting to own facility and recent prequalification from PGCIL for 220 KV cables. Further, fresh order worth Rs8bn baged by SAE Towers in Brazil offers a healthy growth visibility, in our view. We expect strong order intake traction to continue led by higher T&D spending by SEBs, improved railways ordering and recovery in overseas markets.

Outlook & Valuation
Looking ahead, we expect KEC to report steady improvement in margins driven by reducing backlog of low-margin legacy orders, improved margin profile in new orders and breakeven in Tower & Cable business. We expect KEC’s earnings to clock 26.9% CAGR through FY17-20E on the back of strong order backlog and improving margins. Maintaining our positive stance on KEC and rolling over our estimates to FY20E, we maintain our BUY recommendation on the stock with a revised Target Price of Rs445 .

Previous Read: Skipper- 3QFY18 Result - Transmission Capex Play- On Right Track
Next Read: BSE 500 Index in deep red : Is it real or deceptive,What next now?

Sunday, February 18, 2018

BSE 500 Index in deep red : Is it real or deceptive,Is it a buying opportunity. What next now?

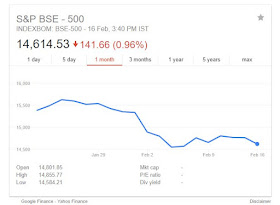
bse500-1month
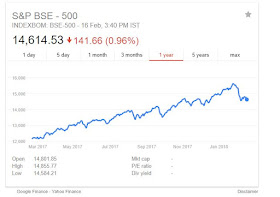
As of Friday Feb 2, 2018, the broad-based BSE 500 is down 5% from its 52-Week high of 15,661 which also happens to be its All-time High.
That does not sound very bad, but why does it feel much worse than what the Index suggests? If most of us look at our portfolio, a 5% drop from the peak is not reflecting the true picture, Is the Index lying? No, it is all Mathematics.

The way an Index is created a higher weight, in general, is given to a company the larger its Market Cap (or free float). In-fact the weight for a particular stock is almost proportional to its Market Cap. So, HDFC Bank has a 6.3% weight and Shoppers Stop has close to 0% weight in the Index. Thus, the Index return is a weighted average return of its constituents.
So now we can figure out why we feel much worse than what the Index is saying.
We all know that the Large Cap companies have done much better than the mid cap companies in the last few weeks.

If for example we took a simple unweighted average of the performance of all BSE 500 stock from their respective peaks, the average is 19%.

Although BSE 500 is down only 5%, just 20 out of the 500 stocks are down below 5%. Almost the same number of stocks, 21, are down more than 40%. If one takes stocks down more than 20%, the number is 208, or almost 41% of all the stocks.
  
The chart below breaks the performance down further:
The above points should make us feel a bit better, although it will not take the returns of our portfolio up!

Most of us do not worry so much about Market Capitalisation and Portfolio Weights and we do not have portfolios that mirror the way the Index is made up. So our portfolios do not have the same performance or the risk of the BSE 500 or any other benchmark. If we compare our returns to any benchmark we need to be aware of this. For example, if we have 10 stocks, 5 large caps and 5 mid caps and all equally weighted, our portfolio has 50% weight in Large Cap stocks and 50% in Midcap stocks While BSE 500 may seem like a better benchmark to judge our performance, as all our stocks may be part of that Index, but a better Index is a 50:50 combination of a Large Cap (say BSE Sensex) and a Mid cap (say BSE Midcap) Index.

The moral of the story is a that to figure how our portfolio is performing we should compare our portfolio with the appropriate benchmark.

Market Optimism Interrupted                      

No sooner had It seemed that we are in an optimism phase, The BSE Small Cap Index is down 10.6%, BSE Midcap Index is down 7.9% and the BSE Sensex is down 2.7% over this week.
Although Global markets have been jittery since the beginning of the year with US 10-Year interest rates moving up, and the stocks which had seen some signs of Euphoria coming down sharply closer home, the Budget has played a big role in this sharp fall.
This begs a question, Is the government trying to bring the market down? In the period 2010-2013, the Singapore government put in a lot of measures to control the speculation and the rise in the property market as it started impacting the economy according to them. The rising property market made “hot money” move to Singapore and also increased the cost of doing business in Singapore. The government measures were aimed to bring macroeconomic stability.
Is the introduction of Long Term Capital Gains in the budget a similar move where the government is trying to limit the allocation of money to the stock market? Hon. Finance Minister's speech seems to hint that for sure. Here's some of what he said as a preamble to introducing the LTCG: “With the reforms introduced by the Government and incentives given so far, the equity market has become buoyant.” “Major part of this gain has accrued to corporates and LLPs.” “This has also created a bias against manufacturing, leading to more business surpluses being invested in financial assets.” (unfortunately, no one can deny this observation)

Barring the Tax and possibly their intent, I feel the budget was not as bad as the market reaction suggests. Given the fiscal situation of India, a budget is always a balancing act and the government has to decide where they focus their resources on. This government has been consistent in focusing on the “Supply Side factors” like infrastructure and “Inclusive Growth” and this budget they have done the same.
The budget is pro-growth, following 12.3% growth in total spending in FY18, the government has budgeted a growth of 10% for FY19. Focus on infrastructure has continued. Railways, Roads, Defense and Agricultural capex have seen the highest growth.
The inclusive part of the budget can be seen from the increase in MSP for crops to 1.5 times production cost to ensure higher realizations for farmers' agricultural produce and also the announcement of National Health Protection Scheme.
BSE 500 Index -1 Year Returns
BSE 500 Index -5 Year Returns

I believe that the long-term fundamentals of the India story are intact. This can be seen in BSE 500 1 year and 5-year returns in the picture above .The Market reaction to the budget is similar to that when PM Modi announced Demonetisation. That too had interrupted the Optimism phase for a while. I believe that when the dust settles down, and I have no clue how long that will take, the market will be back to fundamentals. The interruption can be much longer if the government does not want the markets to go up though!

Next Read : The Era of Easy Money is Coming to an End. What Happens Now?
Previous Read : Skipper- 3QFY18 Result - Transmission Capex Play- On Right Track

Tuesday, February 13, 2018

The Era of Easy Money is Coming to an End. What Happens Now?

Author : Vivek Kaul
The Dow Jones Industrial Average, America's premier stock market index, has fallen by close to 9%, over the last one week (i.e. between February 1 and February 8, 2018).
Closer to home, the BSE Sensex has fallen by 4.2% during the same period. As I write this on the morning of February 9, 2018, the BSE Sensex is down 1.5%, from its yesterday's close.
I think it's time to revisit a few basic things about the era of Easy Money, which has driven stock markets up post September 2008.
In the aftermath of Lehman Brothers going bust (September 15, 2008), and other financial institutions almost collapsing, and having to be bailed by taxpayers in the US and Europe, the Federal Reserve and other Western central banks, decided to print money and pump it into the global financial system.
This printed money (or rather created digitally) in the American case was pumped into the financial system by buying American treasury bonds and mortgaged back securities.
Treasury bonds are essentially bonds issued by the US government to finance its fiscal deficit. Fiscal deficit is the difference between what a government earns and what it spends.
Mortgages backed securities are securitised financial securities derived from mortgages (i.e. home loans).
The Federal Reserve had never owned mortgaged backed securities up until 2008. It had no reason to own private financial securities in order to carry out its open market operations.
It first started buying them only in January 2009. It started buying them only when a lot of financial institutions were in trouble and needed some "real money" to ride out of it.
Before 2009, the size of the Federal Reserve balance sheet was around $800 billion. By the time it finished, printing money and buying treasury bonds and mortgaged backed securities, it had ballooned to more than $4.2 trillion (See Figure 1).
Figure 1.


The hope was that with money supply going up, interest rates would fall, companies and people would borrow and spend money. This would lead to a faster economic recovery. The idea, as always was, that America will spend its way out of trouble.


But that is not how it worked out.
The trouble is that those making economic policies think only about what the economic policy hopes to achieve and not the incentives that it creates. And whether a policy achieves what it set out to achieve depends on the incentives it ends up creating. The incentives that got created in this case, were clearly not what the policy had hoped to achieve.
Companies borrowed money not to expand, but to buyback shares and increase their earnings per share. This, along with the fact that all the money printing had unleashed an era of easy money, led to a rally in US stocks.
Consumers who had just about finished with one round of borrowing (to buy homes primarily), weren't really in the mood to borrow all over again.
The big financial investors saw this as an opportunity to borrow money at cheap rates and invest it in stock markets all over the world. This trade came to be known as the dollar carry trade. A lot of money was made in the process.
It is worth pointing out here that the Federal Reserve, started buying American Treasury bonds big time, only from April 2009, onwards. Before this, it had started buying mortgaged backed securities from January 2009 onwards. The economists called this money printing, quantitative easing.
This money is still a part of the global financial system. This money cannot be taken out all at once, and any process to take this money out of the global financial system, has to be, at best, be a gradual one.
The Federal Reserve of the United States understands this, and has started taking out the money that it had put into the financial system, in the aftermath of the financial crisis. In fact, the Federal Reserve has gradually been sucking this money out of the financial system, since October 2017.
Between October and December 2017, the Federal Reserve, took baby steps, and withdrew a meagrely $10 billion per month. This has jumped up to $20 billion per month for the period January to March 2018. And this will gradually go up to $50 billion per month, starting October 2018.
In order to put the printed money into the financial system, the Federal Reserve bought treasury bonds and mortgaged backed securities. In order to pull money out, it is selling the bonds and the mortgage backed securities.
This year, it is supposed to sell $420 billion of these securities. The current size of the balance sheet of the Federal Reserve is around $4.2 trillion. By the end of the year, it would have shrunk by 10% to $3.8 million.
Next year and onwards, it is supposed to sell $600 billion.
As this money gets pulled out of the financial system, it is obvious that interest rates in the US, will start going up again. In fact, they already have with the yield on the 10-year treasury bond crossing 2.85%, over the last few days.
The yield on government bonds acts as a benchmark to interest that needs to be paid on different kinds of borrowing. (Lending to the American government is deemed to be the safest form of lending). With the bond yields going up, the interest that the institutional investors need to pay on their carry trade borrowings, will also go up.
With interest rates likely to go up, a lot of carry trades will unwind, simply because they will become unviable. As these carry trade unwinds, stock markets all over the world, are bound to fall.
Given that the Federal Reserve is pulling out the easy money it put into the global financial system, slowly, the markets should also fall slowly. While this seems like a logical argument to make, stock market and logic don't go together, at least in the short-term. The stock markets going up in many parts of the world wasn't really backed by an increase in company earnings. It was simply a result of all the easy money floating around.
What is important to understand here is that most investors essentially do what other investors around them are doing. If investors around them are buying, they will buy. If they are selling, they will sell. This herd mentality makes the stock market illogical, in the short-term.
Hence, the speed with which this fall will happen, might be very fast. But more than that the basic point is that the tide has turned, and the era of easy money is coming to an end.
In the context of the stock market, this means that any rubbish will not sell, as has been the case in the recent past. Investors will actually demand earnings from companies (yes, yes, there is a phrase like that) now and not just hope about it, as they have been all this while.
Another lesson here is that it might be difficult to predict the exact timing when the tide of the stock market, turns. But it is fairly easy to figure out whether the stock market is in expensive territory or not.
If you had read some of my earlier pieces, you would obviously know that by now. When these pieces were published, the sceptics said there was no reason for the stock market to fall right now. The trouble is, when markets are going up irrationally, there are never any reasons for them to fall (which is what makes them irrational in the first place), until one reason comes along. This is precisely how things always play out. And this time is no different.
SIPs remain the best way to invest in the stock market, given that most of us really do not have the time, the discipline and the inclination to figure out, what is the best for us, at least when it comes to investing. Also, I am not a big fan of buying on dips, because no one knows when the fall will end, and with this strategy one can end up buying stocks at fairly expensive valuations. So, SIPs remain the best way to buy stocks, in the long-term of 10 years or more.
Of course, the talking heads will keep talking about how the India growth story is still very strong, as they have constantly since 2002. It's your choice whether you listen to that rubbish in the media or make informed educated decisions about your hard-earned money.


Monday, February 12, 2018

Markets have crashed,is this right time to buy?

The Indian share markets fell, quite dramatically, and yet nobody is worried.
Already the markets seem headed back up. The BSE Sensex price-to-earnings is still way too high (about 24x). And people are still shouting about 'buying the crash'.
Just take a step back, and you'll realise how we got here.
You only need look at recent mutual fund data to get a feel for the excitement in the air...
New fund offers (NFOs) in the equity mutual fund industry hit a 10-year high of Rs 223 billion in 2017. At about Rs 3.8 billion, the average NFO size is also the highest since the glory days 2007-08.
NFOs are new schemes started by MFs inviting people to invest in them for the first time. And to flourish, NFOs need not just investors, but extremely excited investors.
Just how excited are investors nowadays?
Enough that NFOs' contribution to total MF sales has increased almost four-fold - to a whopping 14.7% in 2017 from just 4.6% in 2016. Interestingly, NFOs had just about gone extinct as recently as 2011-12.
Overall net investment (sales minus redemptions) in MFs has also been breaking new records these days:

And, of course, MFs are having a gala time taking all this money from over-eager investors and funneling it into equities.
After all, a mutual fund makes money as a proportion of the total amount of money it manages. The more the merrier.But MFs are not the only market intermediaries doing this.Companies, initial public offerings (IPOs) markets, investment bankers, brokers - basically anyone and everyone whose interests are aligned to how much investor money they can bring in to equities is doing the same with a newfound vigour.
Like vultures in the brutal African savannah swooping down on an easy meal, intermediaries across the stock market are swooping down on excited investors who are only too willing to hand over their money for a bagful of stocks.And we understand why; it is not easy for an investor to get a 'do nothing' recommendation when everyone else around them is getting drunk on stocks.
But that's exactly what's needed right now.
Just look at the mutual fund chart above and compare it to the stock market's movements. The period between Jan 2013 to April 2014, and the first three months of 2016 were relatively the best periods to put money into stocks.
Sadly, the janta was doing the exact oppositeAnd they continue to make the same mistake today.Even at the expense of coming across as 'boring' and 'repetitive', I'm going to say once again: Don't load up on too many stocks. Not yet, at least.

Next Read : What to Do in Market Crash

What to Do in Market Crash

    "During such scary periods, you should never forget two things: First, widespread fear is your friend as an investor, because it serves up bargain purchases. Second, personal fear is your enemy. It will also be unwarranted." - Warren Buffett

Before the Budget, Indian stock markets were on a roll. Markets gained an impressive 28% in the past one year. The Sensex closed above 36,200 on 29 January. It seemed nothing could halt this juggernaut.


Then all hell broke loose. Clearly, the long-term capital gains tax did not go down well.


But there is a much simpler explanation at hand.


What Goes Up Must Come Down
Markets have never moved only in one direction. In raging bull markets, often a single negative trigger can reverse the direction. In our case, it turned out to be the Budget.
But Don't Be Afraid


Market crashes are nothing to be afraid of.Crashes are necessary, from time to time, for the healthy functioning of markets. A big loss on any one day does not mean a bull market has changed to a bear market.It means that a much-needed correction is finally happening.
The world's richest investor, Warren Buffett, loves market crashes. In his 2017 letter to shareholders, he wrote:
    "The years ahead will occasionally deliver major market declines -- even panics -- that will affect virtually all stocks. No one can tell you when these traumas will occur."
Indeed. No one could have predicted this correction.
We had reached a stage where the market had become very expensive. A correction was badly needed to bring valuations down to reasonable levels.
What Should You Do Now?
Market corrections like this one, are a great opportunity to accumulate high-quality stocks at sensible prices.
"The 800-point crash in the Sensex, today, was not an over-reaction to the Budget. As much as the business papers and talking heads would like you to believe so, that's not true. Rather such a correction was in the offing for long. And it is something I have been warning you about for a while.For a safety-first investor, such corrections should ideally be the period of maximum activity."
Also, If the market keeps falling... stay tuned for more good opportunities.
In conclusion, here's what I believe you should do.
  • Do not give in to fear.
  • Know that the market will recover.
  • Focus your efforts to identify the highest quality stocks.
  • Check if their prices have fallen to attractive levels.
  • If yes, buy them and hold for the long-term.
  • If not, be patient and wait for the right price
 The market was due for correction and budget became the trigger. In my opinion, even if the budget did not have LTCG, markets would have still fallen but the loss was extended with this bad news.
10% LTCG is definitely a dampener but cannot be the reason for markets to crash.

Where else can you really invest if not equity for higher returns. And if markets can give you 15+ CAGR, then I am sure even post tax returns are much higher than than any other asset class.

Also LTCG is levied on all developed and most developing economies so it’s not new for FIIs.
They were just enjoying the benefit so far.

So to answer your question, YES this will be an opportunity to invest or even average but hold on to your nerves. You might see some more downside in the coming week (especially till Wednesday) before the market settles down.

If you are looking at stocks, you can find value buys and if you are looking to invest in MF, I would recommend deploying your money in parts. A weekly SIP could be helpful in such scenarios.
India is a growth story and there is no doubt about it. Think long term and use these knee jerk reactions to build a portfolio.

Next Read : Why: Midcap and Small stocks taking a hit in spite of the Nifty going up?

Prevous Read:Markets have crashed,is this right time to buy?

Tuesday, February 6, 2018

Why: Midcap and Small stocks taking a hit in spite of the Nifty going up?

This is part 2 of the article.
Part 1 of this post can be read at Why:NSE and BSE are shooting up and my stocks portfolio is sinking down daily?

Sensex closes at fresh high: Mid-caps, small-caps decline amid high volatility

On 18-Jan2018,Markets continued their bull run as sentiments remained buoyant amid forthcoming quarterly results and rising global markets. Sensex gained 178 points and closed at 35,260.29 whereas Nifty gained 28 points and closed at 10,817. The rally was also supported by banking stocks that witnessed strong buying pressure on expectations that government will increase foreign investment limits. Although, the markets turned volatile in the later part of the day as Sensex wiped out over 400 points from the day's high. Both mid cap and small cap stocks declined. BSE mid cap index lost over 300 points whereas BSE small cap index lost over 400 points.

Over 73% of the stocks that are traded on BSE today declined. Out of 3086 stocks, 2262 stocks declined, 696 stocks advanced and 128 remains unchanged. Adani Enterprises and UltraTech Cement declined close to 5% and 3% respectively after reporting decline in net profit in Q3FY18.

Among the A category stocks of BSE, MindTree (9.98%), Gruh Finance (8.65%) and Wabco India (4.22%) were the biggest gainers. The top 3 sensex gainers were ITC (2.61%), HDFC Bank (2.15%) and HDFC (1.99%). HDFC Bank market cap crossed Rs 5 lakh crores, becoming the first Indian bank to do so.

Out of the 19 BSE sectoral indices, 15 indices declined and 4 indices advanced. Metal, telecom and basic material stocks witnessed heavy selling pressure.

Among the global peers, Asian stocks advanced helped by surging stocks on Wall Street. Expectations of tax cuts, strong corporate earnings and healthy global economic recovery lifted US stocks. Japan's Nikkei Index slid after hitting 26-year high due to underperformance of financial stocks.
NIFTY stocks comprise of heavy weights which can only be moved by FII buying and selling. Midcap and small cap stocks move by DII buying and selling.
If you are talking of the recent week move by the NIFTY it is due to FII buying in IT stocks and banking stocks.
Screenshot of FII buying and NIFTY moving high relatively.

You can see FII Buying and DII selling

More over,
NIFTY is up only 6% in last 3 months whereas, Midcap and Small cap are up 12% and 14% in the last 3 months respectively after the correction.
You should buy quality stocks across captial and at various timeframe. Avoid panic selling and greed buying.
Always use correction to buy in the bull market.

Nifty returns in Last 1 month (4.1%):

If your portfolio has Midcap stocks and small cap stocks then compare your returns to your respective index. It is not bad to hold stocks through correction. If you were technically good, you could have booked profits just before the correction and must have entered in fresh stocks by now.
Even after the recent correction in the midcap and small cap stocks recently, they outperform NIFTY in the last one month.

Midcap returns in last one month (4.7%):


Small cap returns in last one month (7.4%):


Market outlook Going forward:
Technical correction was expected in both NIFTY and the broader market. Nifty, bank nifty and nifty IT was seen lesser correction of max 1-4% and correction in Metals, midcap, small cap was seen max at 6-13%.
While the correction started this week Nifty IT had given a strong support to the NIFTY while Metals, midcap and small cap atarted to correct. Next day, the news on fiscal deficit rallied the Banks.
Moving forward, while banks and IT Consolidate other stocks like UPL, Airtel, Reliance, ONGC will support the market.

Suggestion
Technical correction is getting over in sectors like metals, small cap and midcap. Use next good rally to exit overbought stocks. Next technical dips can be deeper with any bad news. You can add fresh stocks there. Stay bullish on Indian Stock market as a whole.
Market returns and good return probabilities are higher while the markets are at their new highs than the returns and high return probabilities at market lows.

3 months back the NIFTY was said to be costly and was at its high. The returns of the portfolio is above the market returns in the last 3 months.

Enter quality stocks, buy on dips, have a good stoploss and beat the market returns.

“Existing investors” should not worry about the volatility in the space. Such correction will come and go but there is no trigger for a big fall in the mid and smallcap space. “New investors” are better off in multicap schemes as the valuations in the small and midcaps are becoming too high.

Next Read :HDFC Bank-3QFY18 Results Update - Loan Growth Momentum Continues
Previuos Read: What to Do in Market Crash

Q3FY18-Sector Review:
Pharmaceuticals Sector -Q3FY18-Results Preview
FMCG Sector-Q3FY18-Results Preview
IT Sector-Q3FY18-Results Preview
Banking Sector-Q3FY18-Results Preview
Cement Sector-Q3FY18-Results Preview